EnergyDataHackdays 2024: Driving Innovation and Collaboration in the Energy Sector


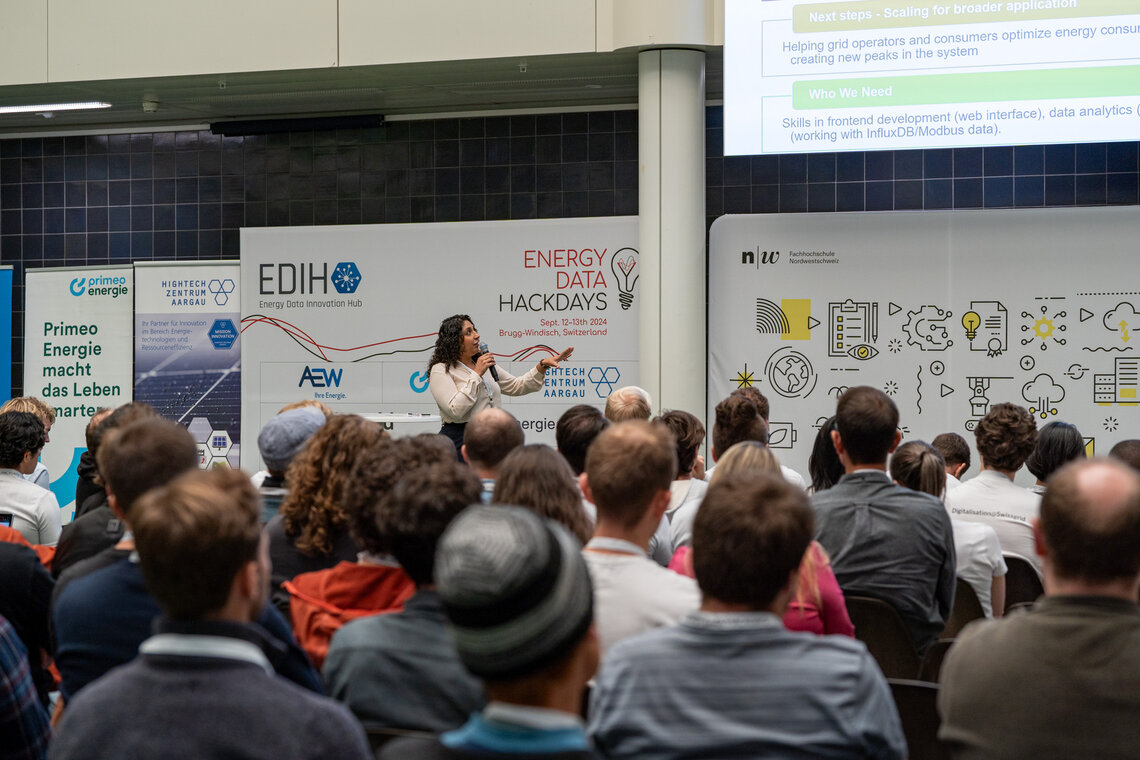
The NCCR Automation challenge, prepared by OST and led by Varsha Behrunani and Benjamin Sawicki, looked at real-time grid load visualization and consumer impact analysis. The aim was to create a user-friendly web interface that visualises the load measured by power meters, and to incorporate sample household consumption data to explore how this individual data correlates with the overall grid pattern. At the end of the workshop we wanted to be able to show end-users how their behaviour affects energy peaks in the grid, to understand that using electricity outside of peak times can reduce costs and the burden on the infrastructure.
Our work began with explaining the background of the problem to our team, including making sure everyone understood the basics of electricity pricing, how peaks in usage have an impact on short- and long-term prices, and how these costs are passed on to end-users. We then split off into three key areas:
- Analysing mid-voltage grid data to find peaks and monitor their duration
- Looking for correlation between peaks of use within given households and the grid as a whole
- Creating visuals for a front-end mobile interface that will allow consumers to understand how their energy consumption compares to others attached to the same grid
The challenge was especially timely as the DSO for central Switzerland, CKW, has announced that from 2025 their tariffs will be updated to incentivise spreading energy consumption throughout the day, so creating a usable interface that gives customers a "traffic light" grade on their usage, can help them to be smart and keep their bills lower.
The source code for our solution, along with many others from the event, can be found on the opendata.ch platform. If you are interested to know more about this topic, or how you can get involved, please reach out to one of our KTT officers, Claudia Fischer or Benjamin Sawicki.